• Read
  • Publish
  • About

Read

Explore current and past TAD issues and related content.

Current Issue

Learn more about our current issue

Past Issues

Browse our compilation of past issues

Extras

Webinars, videos, articles and more

Publish

View submission guidelines, learn more about our review process and find helpful recommendations for publishing work in TAD Journal.

Call for Papers

Submit work for our next issue

Author Guide

Explore editorial tips and recommendations

About

TAD Journal is a peer-­reviewed international journal dedicated to the advancement of scholarship in the field of building technology and its translation, integration, and impact on architecture and design.

Our Mission

Learn more about our vision and values

Editorial Board

Meet the minds bringing our mission to life

Advisory Board

Meet the experts shaping TAD’s future

Issue 1.2

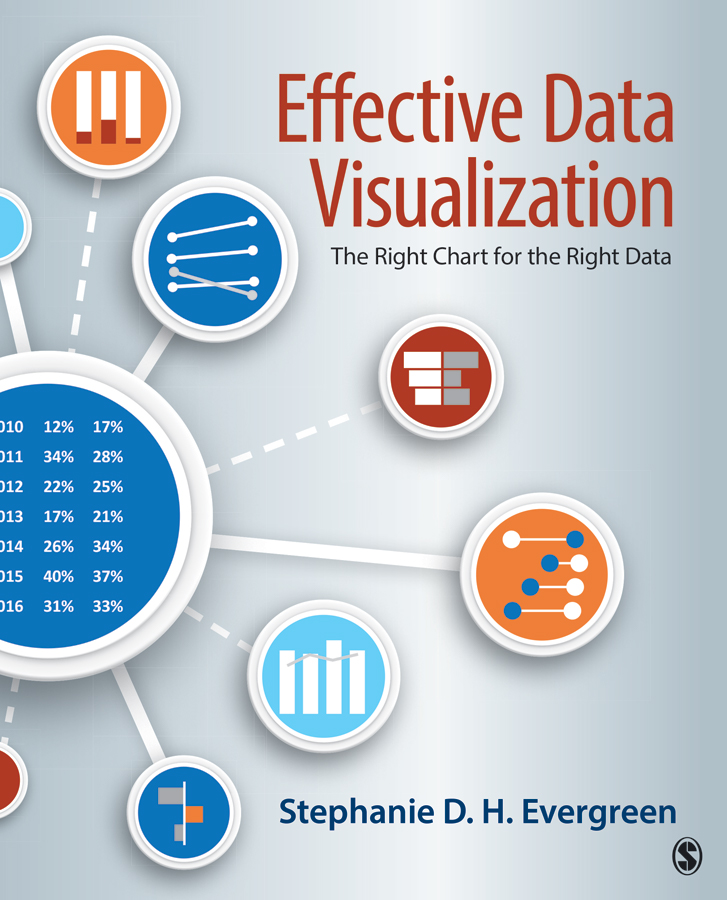
Effective Data Visualization: The Right Chart for the Right Data, and Data Visualization: A Handbook For Data Driven Design

Though not always obvious, there is a notable difference between research that searches for the truth and research that looks for an answer. In the former, the researcher considers the context of the data he or she is using and prioritizes accuracy and legibility when creating visualizations. The later, however, places emphasis on communicating a specific idea that may or may not be legitimate. Regardless of how effectively the researcher can translate data to insight, the researcher has a duty to be true to the data collected.